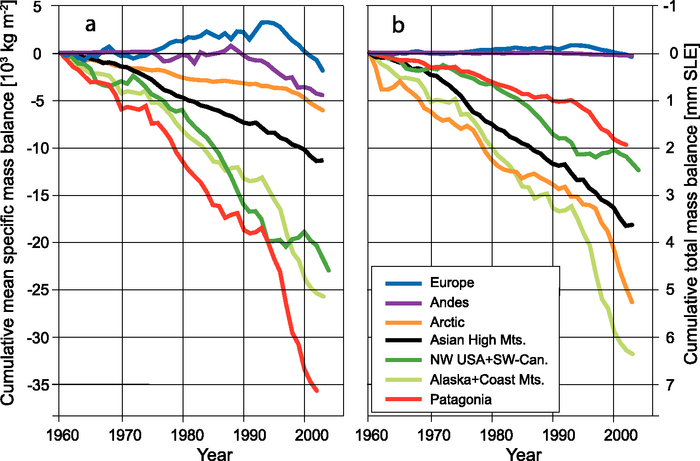
glaciers from 1960-2005 (IPCC, 2007)
Many glaciers across the globe are currently in a state of retreat. Generally, these glacial retreats are a function of increased regional temperatures and reduced snow accumulation. These factors are driving the mass balance of glaciers into negative values (DeBeer et al., 2016). This means that these glaciers do not have enough snow accumulating at high altitudes to replace ice melt at low altitudes (See Glacier Formation section). As seen in Figure 1 the cumulative mass balance of Patagonian, American and Canadian glaciers are declining at the most rapid rates. The current states of various regional glaciers are discussed below.
Canada
There are more than 20,000 glaciers in Canada – the exact number is unknown – covering approximately 186,000 km2. The bulk of this ice is in the Canadian Arctic Archipelago (Radić and Hock, 2010). The Prince of Wales Icefield on Ellesmere Island (19,325 km2) represents the world’s largest single ice mass outside of Greenland and Antarctica. British Columbia and Alberta have about 17,600 glaciers, covering a smaller area (26,700 km2 in 2005; Bolch et al., 2010). There is also extensive glacier cover in the St. Elias Mountains in Yukon. Recent trends in both western and high Arctic glaciers in Canada (Figure 2 and Figure 3) indicate a decrease in Mass Balance of up to -40,000 millimeters water equivalence (Figure 4 and Figure 5) (Natural Resources Canada, 2010).
Western Canada was studied by Wheate et al. for the years 1985 to 1999 where they found that the volume lost each year for individual glaciers was 22.48 km3/yr (2014). Other measurements agree with the large recession of Canada’s glaciers. Colgan et al. (2015) measured the mass lost between 2003-2009 in all of northern Canada and found a loss of 42 Gt/yr.
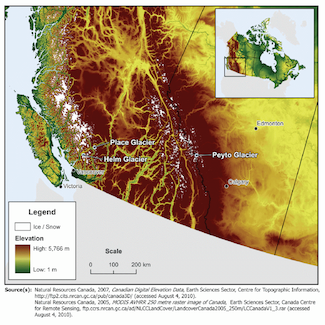
Figure 2
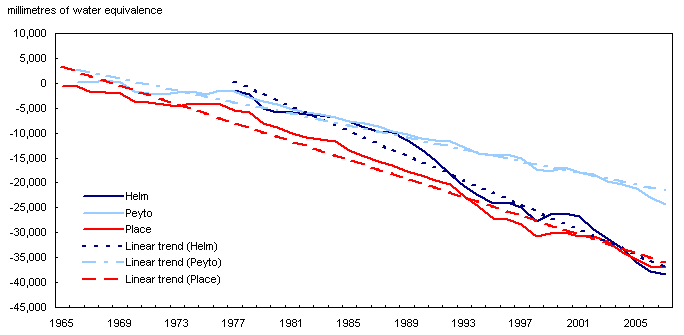
Figure 4
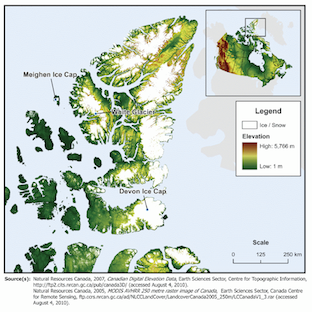
Figure 3
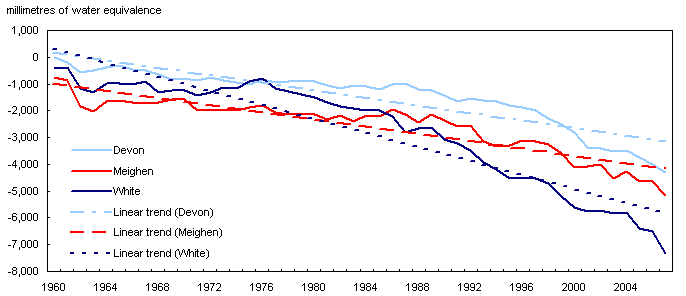
Figure 5
Click figure for larger image. (Natural Resources Canada, 2010)
The Polar Ice Sheets
In Greenland and Antarctica, ground observations of the ice sheets are very difficult and scarce, so satellite observations provide information on recent changes. Greenland’s mass balance has been negative, with coastal regions thinning and losing glacial ice, since the early 1990s (AMAP, 2009), after what is believed to be a period of near-balance through much of the 20th century. This is due to a combination of increased surface melting and accelerated ice discharge into the oceans. Ice loss rates have increased since 2005 and even more since 2010, with the Greenland Ice Sheet contributing to global eustatic sea level rise at an average rate of 0.77 mm/yr from 2005-2014. Between the years 2005-2009 the average rate of rising was 0.57 mm/yr, while more recently between 2010-2014 that number has increased to 0.89 mm/yr (Yi, Sun, Heki, Qian, 2015). Acceleration of major tidewater glaciers, responsible for much of the ice loss, may be triggered by regional ocean warming and reduced sea ice to hold the glaciers in place.
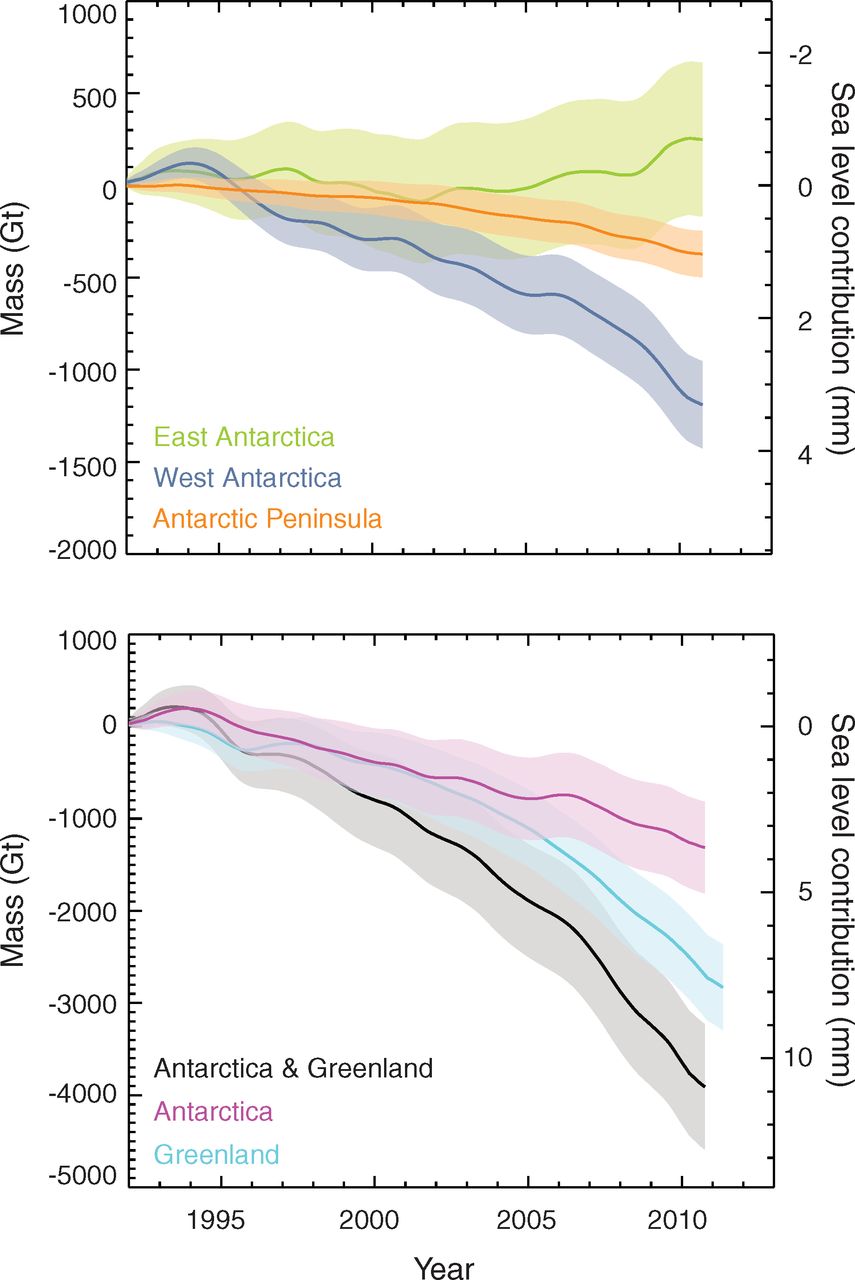
and Sea Level contribution (right axis) for various
Antarctic and Greenland Ice Sheets (Shepherd et al., 2012).
While it is not strongly affected by the atmosphere, the Antarctic Ice Sheet is also vulnerable to ocean forcing. Rignot and Jacobs (2002) estimate an increase in the basal melt rate of floating ice shelves of 10 m/yr for every 1°C of ocean warming. This has played out in the Amundsen Sea sector of West Antarctica in the 1990s and 2000s, with thinning rates of tens of meters per year near the grounding line of the Thwaites and Pine Island ice tongues. This generated a wave of thinning that has propagated inland, contributing to an overall loss of ice in West Antarctica that is detected by the GRACE satellite (Velicogna and Wahr, 2006; Velicogna, 2009; Rignot et al., 2011; Figure 6). Some of this mass loss is also associated with increased melting and glacier discharge on the Antarctic Peninsula. Breakup of the Wordie and Larsen Ice Shelves in the past two decades, most likely driven by atmospheric warming, has prompted glacier acceleration (Scambos et al., 2000). Shepherd et al. (2012) estimated Greenland ice losses to be 2700 ± 930 Gt and Antarctic ice losses of 1350 ± 1010 Gt between 1992 and 2011 (Figure 6).
Ice losses from Greenland and Antarctica have contributed roughly to a doubling in the rate of global sea level rise, relative to the average rate of 1.7 mm/yr in the 20th century. Shepherd et al (2012) estimated an increase in global sea level of 11.2 ± 3.8 mm as a consequence of melting Greenland and Antarctic ice sheets within the last two decades (Figure 6). Combined with a contribution of mountain glaciers and ice caps, Yi et al. (2015) estimated that the total cryospheric contribution to sea level rise over the last decade has averaged about 1.9 mm/yr.
melt extent and melt type (NASA, 2013).
Click figure for larger image.
It has generally been assumed that high-elevation, melt-free areas of the Greenland and Antarctic Ice Sheets will thicken with climate warming, due to increased snowfall. The Antarctic ice sheet has already been found to be gaining more mass than it is losing. This net gain is most likely temporary because the rate at which Antarctica loses ice has been steadily increasing. Eventually the gains from increased precipitation and losses from increased melting and calving will result in a net loss overall. Zwally et al. (2015) estimate that at current rates the losses will outweigh the gains in approximately 20 years, but for the moment Antarctica will be gaining mass.
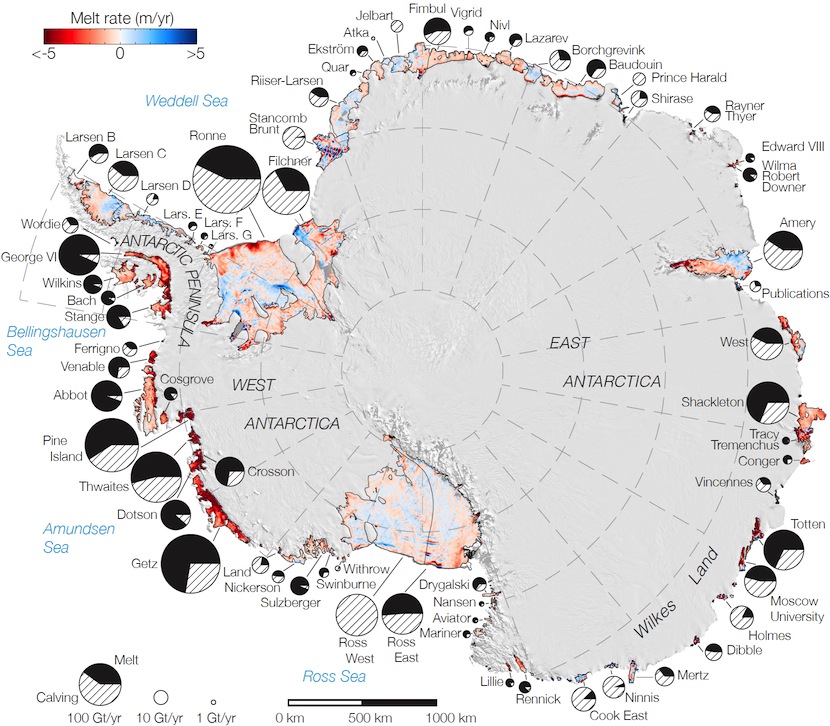
NASA researchers have found that increases in sea surface temperatures have recently melted Antarctic ice shelves from below. Figure 7 displays the melt rates of Antarctic ice shelves (red indicating melt, blue indicating accumulation). The circular graphs display the extent of melt (size) and proportion of disintegration type. It is clear that melt rates are extensive throughout Antarctic Ice Shelves, particularly in western regions (NASA, 2013).


Svalbard
Slight growth of ice caps has been recently discovered in Svalbard, however glacier retreat is occurring as well. In the last 30 years Svalbard’s glaciers have experienced a 7% reduction in area, which is about 80 km2 (Nuth et al., 2013). Over this time these glaciers have also contributed to sea level rise as a result. Notably, the Hansbreen tidewater glacier (See Glacier Types Section) has been recently releasing vast quantities of icebergs into the Arctic Ocean (Solomon et al., 2007; Otero et al., 2011).
Mainland Norway
North Atlantic Oscillation influences in the 1990s induced glacial growth. However, since the termination of that atmospheric phase at the turn of the millennium, glacier retreat has been occurring. A recent continuous retreat is a consequence of steadily increasing temperatures and decreasing snow accumulation in Norway. The highest degree of glacial retreat currently in Norway is 2.5km. Maritime glaciers in Norway have been melting to a higher degree than continental glaciers. A similar trend is transpiring in New Zealand (Solomon et al., 2007; Winsvold, Andreassen, Kienhols, 2014).
The Alps
This region has recently been plagued with numerous seasons of record breaking mass balance losses, attributed to rising temperatures and reduced snow accumulation. It is estimated that approximately 3% of glacial volume retreats annually in this region. For this reason, it is estimated that Alps glaciers may disappear completely by the middle of this century (National Geographic, 2007; Solomon et al., 2007).
Patagonia
Glaciers in Patagonia (the Andes) are currently retreating faster than almost any other glacier on Earth. These glaciers are receiving reduced amounts of annual snowfall and are experiencing higher temperatures within the last half century. The westward winds, transported over the Andes supplies Patagonia glaciers with precipitation. These winds have recently weakened as a result of climate change, reducing the quantity of snow accumulation, influencing glacial retreat. Notably, the Gualas Glacier has retreated almost 9km in the past 110 years (WHOI, Lippsett, 2012).
Asia
Many glaciers in Asia have retreated recently. However, due to increases in snow accumulation, some areas have seen glacial advancements. Many regions of the Himalayas are inaccessible, allowing very little observational analysis. Recent glacier trends in this region have mainly been examined using satellite data. Amplified study and analysis of the various glaciers in Asia is required to gain a better understanding of recent glacial flux (Solomon et al., 2007; Black, 2012).
The following video presents current international research monitoring program of the (Napalese) Himalayan Glaciers by Ultrecht University, the International Centre for Integrated Mountain Development and ETH Zurich:
Material on this page was provided by Professor Shawn Marshall (Canada Research Chair in Climate Change, Department of Geography, University of Calgary, Alberta), Maren Pauly and Tristan Mills (Department of Geography, University of Waterloo).