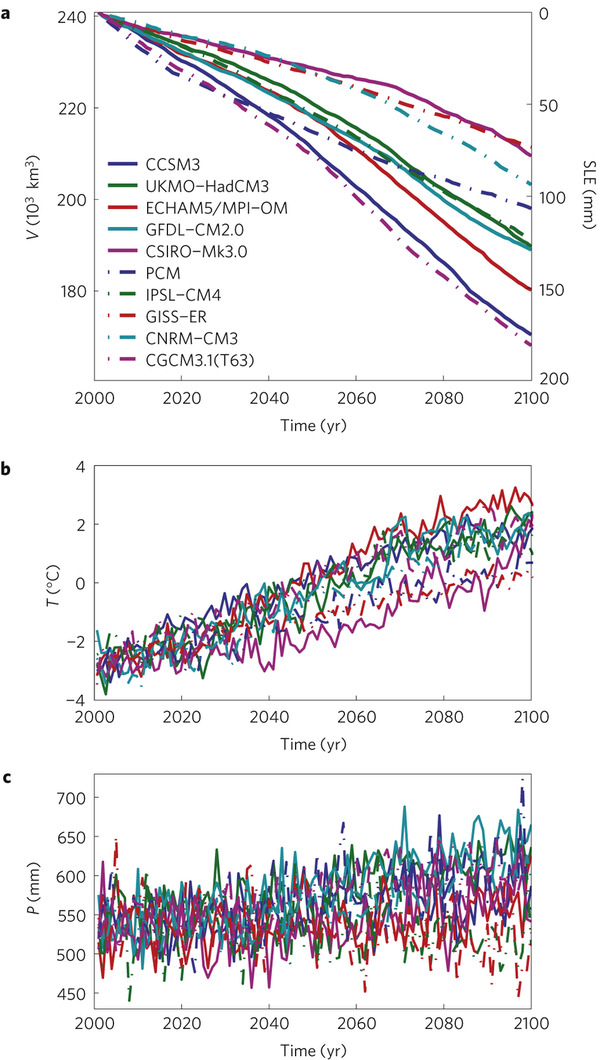
(b) Temperature and (c) Sea Level Rise.
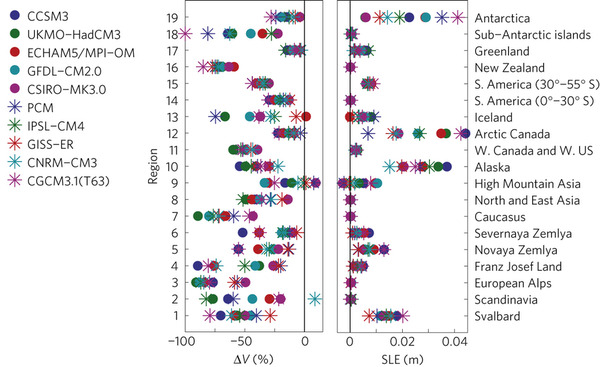
Figure 2: Volume change using various
global climate models and corresponding
sea level elevation rise of various glaciers
(Radic & Hock, 2011). Click figures for
larger images.
Globally, glacier volume has steadily decreased since the termination of the Little Ice Age in 1850. However, recent decades suggest ice volume loss is occurring at unprecedented rates, due to anthropogenic climate change (Radic & Hock, 2011).
Radic & Hock (2011) compiled ten global climate models, to predict the effects of future climate change of glacier volume and corresponding sea level elevation (Figure 1). According to the A1b emissions scenario, applied to the global climate models, glaciers around the world will loose 8-75% of their present volume. The A1B Scenario describes an anthropogenic emissions future case where economic and population growth is rapid, and energy use is balanced across a variety of platforms (Solomon et al., 2007; Radic & Hock, 2011).
The amount of glacial volume lost is dependent on a variety of factors, including influence of precipitation and temperature, glacial topography, location and climatic thresholds. Generally, as temperatures and precipitation increases globally, cubic volume of glaciers decrease. On the low end, Greenland is expected to loose 8 ± 4% volume and High Mountain Asia will loose 10 ± 16%. In contrast, the Alps region is expected to see a volume loss of 75 ± 15%, and New Zealand 72 ± 7%. The quantity of volume lost does not necessarily correspond positively to sea level elevation rise (Figure 2). For example, New Zealand is expected to loose a high quantity of cubic ice volume according to all climate models, but will have little effect on sea level. Conversely, Arctic Canada is expected to loose a moderate amount of ice volume (10-25%), but has the potential to highly effect sea level elevation. This circumstance suggests the complexity of regional variability, thresholds and global implications of glacial melt (Marshall et al., 2011; Radic & Hock, 2011).
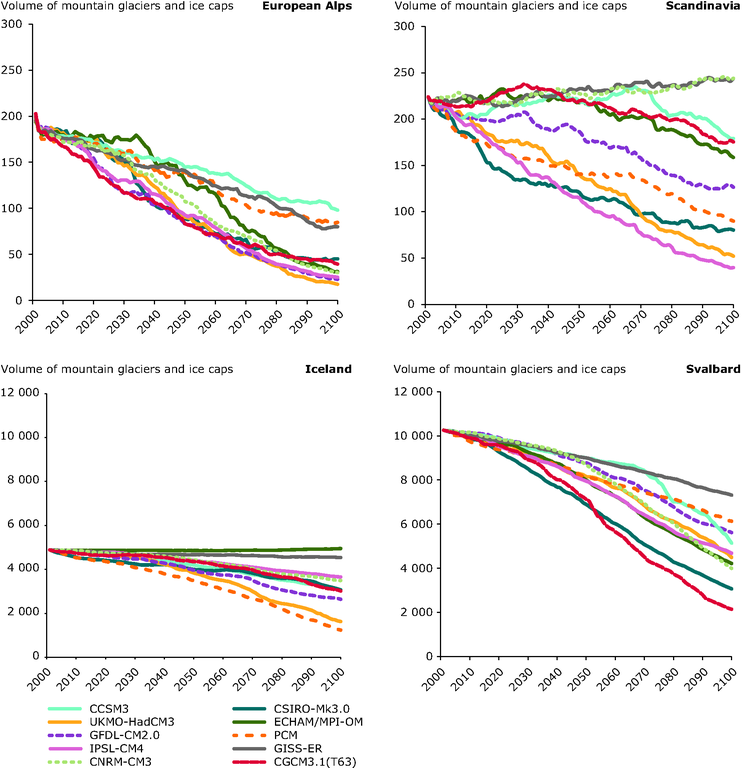
global climate models of temperature
and precipitation (European Environment
Agency, 2012). Click figure for larger image.
Mountain glaciers make up less than 1% of global glacial ice, however, they exert the largest impact on sea level rise. Estimates by IPCC predict a 0.07-0.17m sea level rise by the end of the century by melt of mountain glaciers alone. This melt process contributes one third of the total sea level rise expected. Although this influence is extensive, it is estimated that less than 50% of mountain glacier volume will melt by the end of the century. This means that the trend of influencing sea level elevation will continue into the 22nd century (Radic & Hock, 2011). The European Environment Agency utilized glacier mass balance models and global climate models to predict volume changes in various Arctic mountain glaciers (Figure 3). Almost all climate models predict widespread volumetric losses, especially within the European Alps (EEA, 2012).
References
Glaciers Links
Material on this page was provided by Maren Pauly, Department of Geography, University of Waterloo.