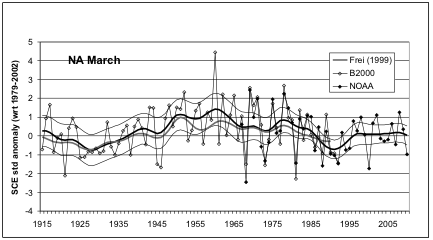
extent from 1915 to 2010 obtained from historical
reconstructions (Brown, 2000; Frei, 1999) and the NOAA
weekly satellite dataset. Smoothed curves highlight the
longer-term variability of the mean and the estimated 95%
confidence intervals. (Brown and Robinson, 2011).
Ask any Canadian baby-boomer about snow and they will invariably recall it being much snowier when they were younger. There are a number of non-climatic reasons that may contribute to this perception, such as snow banks looking higher when you were small, improved snow clearing practices, and a tendency to remember more extreme events. However, there is a factual basis to this perception for people who did much of their skiing before the 1980’s: Historical and satellite-derived information on late-winter snow cover extent over North America show that the period from the 1950's to the 1970's was the snowiest since the early 1900's and that there has been a marked decrease in snow cover since the early 1980's (Figure 1). Snow cover extent and snow depth are significantly correlated over the mid-latitudes of North America in March so we can infer that the 1950’s and 1960’s were also a period with above-average snow depth.
Trends in snow cover extent in Canada since the 1970's are also summarized in EnviroStats, an on-line publication of Statistics Canada, Environment and Climate Change Canada, and Natural Resources Canada. More EnviroStats snow cover trends can be seen here.
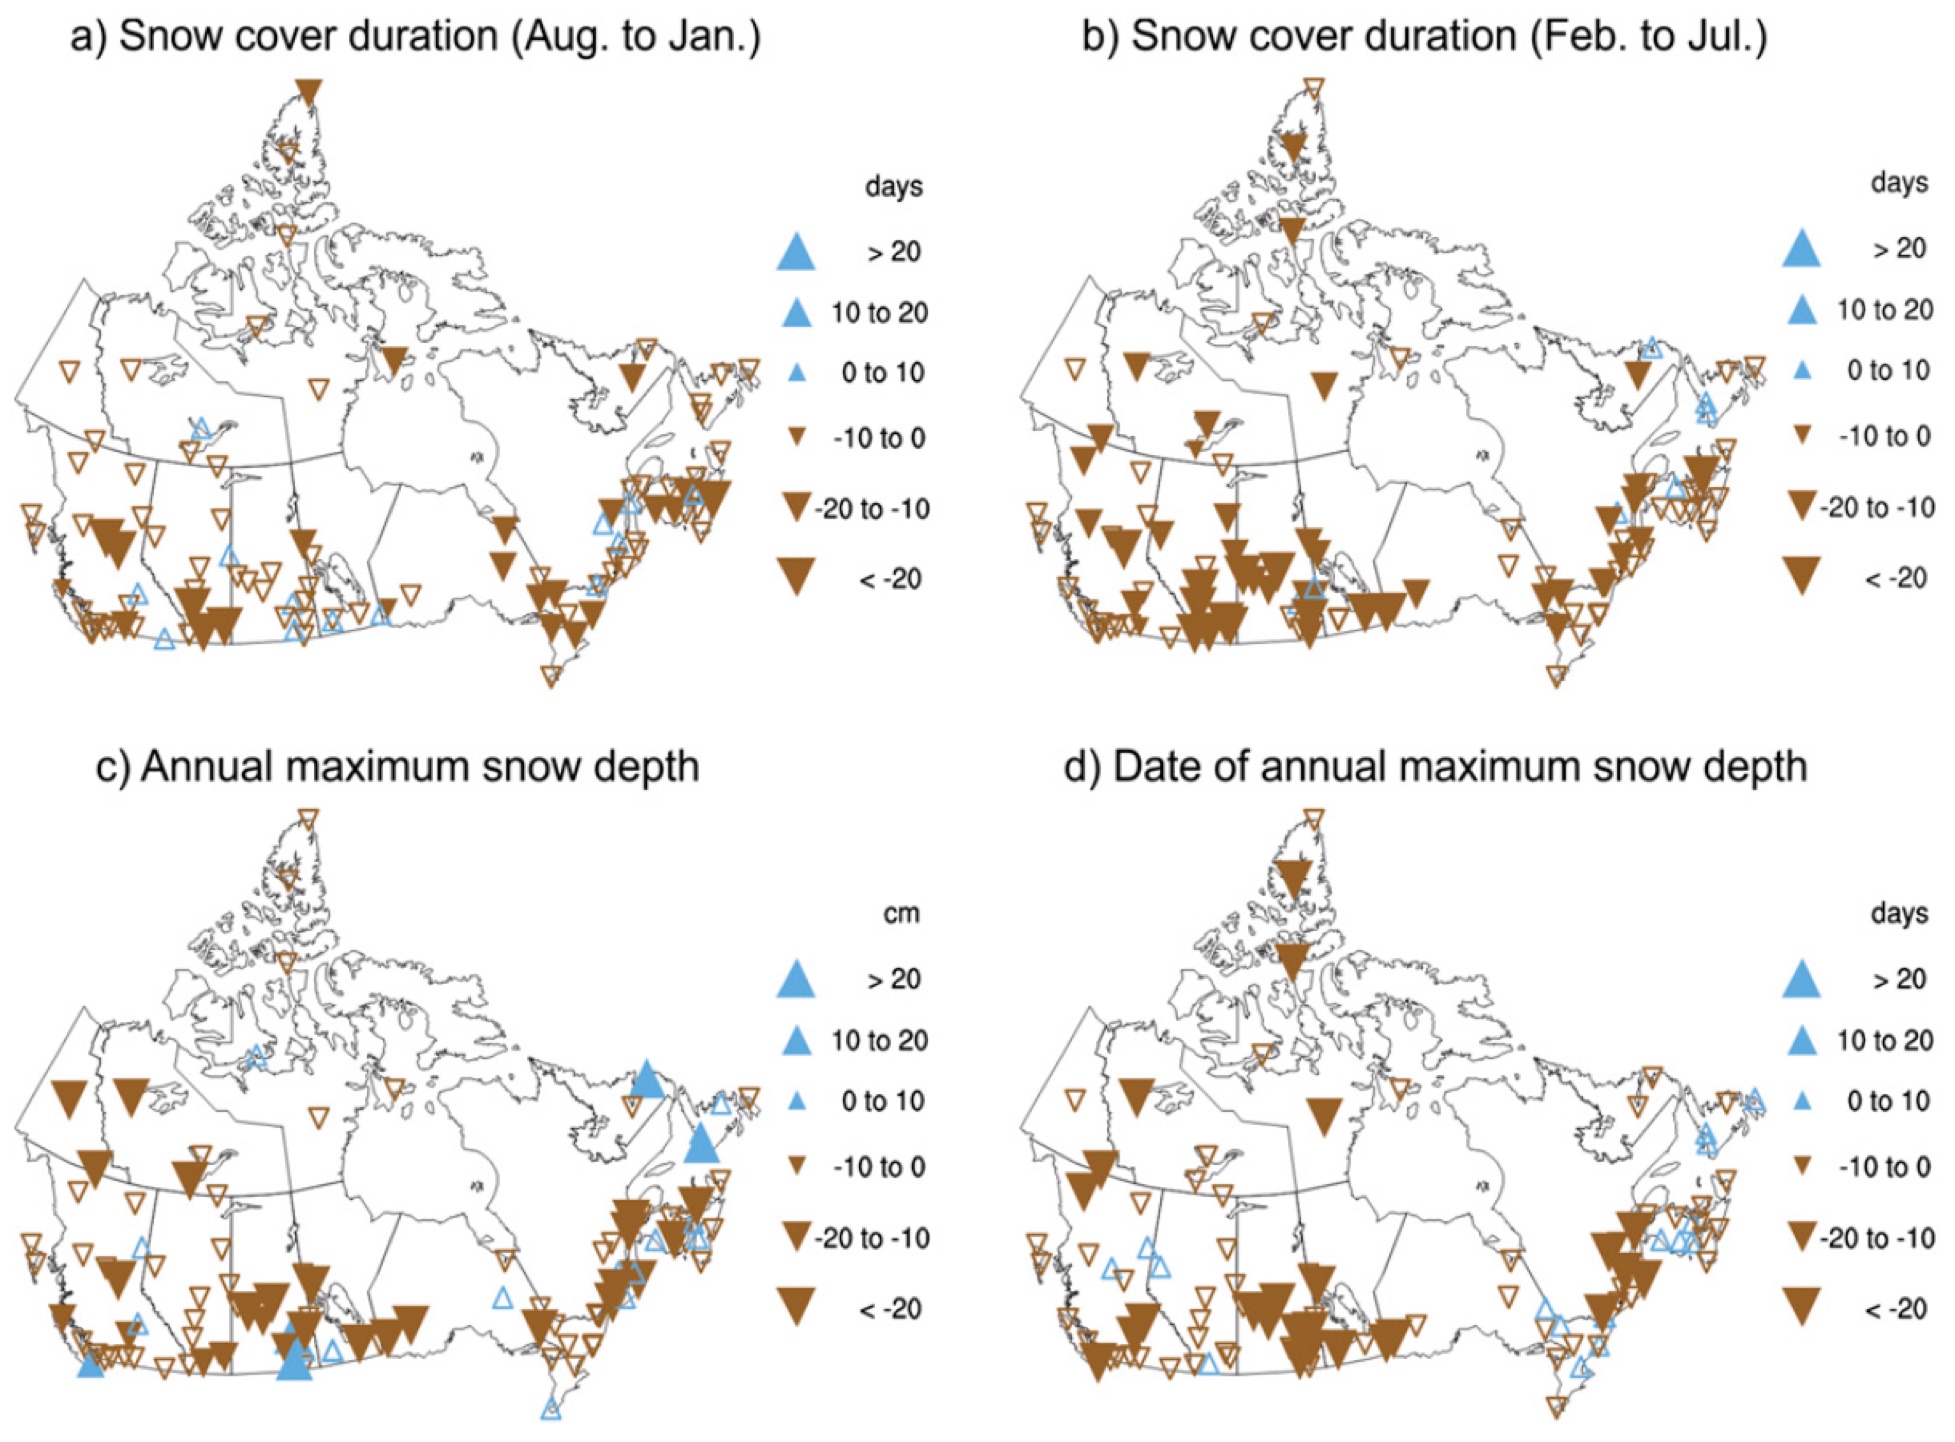
(downward) pointing triangles indicate Positive (negative)
trends. Solid triangles correspond to trends significant at the
5% level. (Vincent et al. 2015).
Click figure for larger image.
Snow depth measurements are made daily at Canadian climate stations from manual ruler observation or from automated gauges that continuously measure the distance to the snow surface via ultrasound. Trend analysis of stations with continuous daily snow depth data from 1950-2012 (Figure 2) shows that the duration of snow on the ground has decreased almost everywhere in Canada with the largest decreases in the spring. The average decrease in snow cover over the period was 18 days and was accompanied by decreases in maximum winter snow depths and a shift in the date of peak snow accumulation to earlier in the season. The decrease in the maximum snow depth over southern Canada is being driven by less winter precipitation and a lower fraction of precipitation falling as snow in response to winter warming (Vincent et al. 2015). Satellite monitoring of the total snow covered area of Canada began in the early 1970s and these data confirm the significant reductions in spring snow cover seen at the climate stations.
The following movie displays 13 years of snow cover on the globe. Grey regions indicate no snow cover (or insufficient data), blue to white areas represent some snow cover (lighter regions have a higher cover percentage) (SWIPA, 2011).
Material for this page was provided by Maren Pauly and Tristan Mills, Department of Geography, University of Waterloo.