of Arctic Monitoring and Assessment Programme
(AMAP), Figure 3.29, AMAP (1998). Click figure for
larger image.
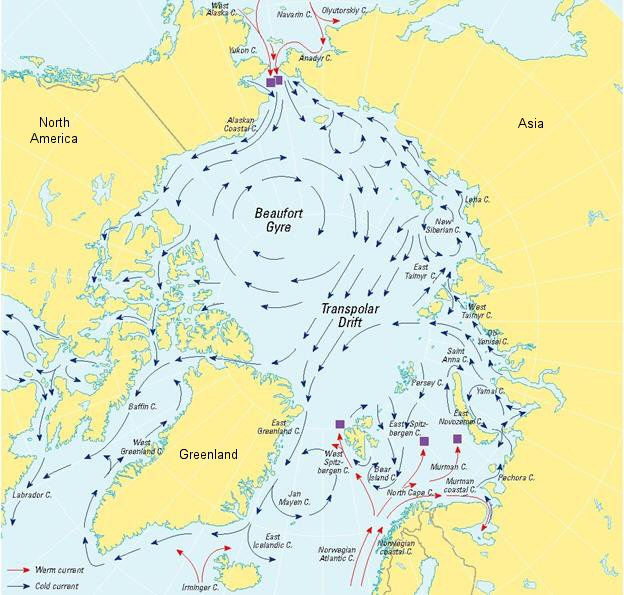
Sea ice undergoes constant motion. The mean ice drift pattern in the Arctic Ocean has two main components (Figure 1): the Beaufort Gyre and the Transpolar Drift Stream (TPDS). The Beaufort Gyre is the clockwise/anticyclonic motion of sea ice in the Beaufort Sea, north of Alaska, caused by an average high pressure system that spawns winds over the region, keeping sea ice in the Arctic basin. TPDS, on the other hand, primarily pushes ice out of the Arctic Basin from the Kara, Laptev, and East Siberian Seas north of Russia to the Fram Strait east of Greenland. Consequently, new ice is often formed in the Western Arctic and the thickest ice is often distributed along the northern coasts of Canada and Greenland. Unlike earlier in the 20th century, ice since the late 1990's has not survived the clockwise transit through the southern portion of the Beaufort Gyre to become thick multi-year ice. The strengthened Beaufort Gyre, under current conditions, assists in the transition to a younger, less extensive perennial ice cover rather than helping to replenish the old, thick ice.
The mean ice drift is strongly connected to the average atmospheric surface pressure, expressed as ocean surface current and winds. The ice outflow through Fram Strait is highly changeable at seasonal time scales with a winter maximum and a late summer minimum. On interannual scales, sea ice drift is correlated with the Arctic Oscillation, which refers to opposing atmospheric pressure patterns between northern middle and high latitudes. During the positive winter AO compared to negative AO, the Beaufort Gyre is smaller and the Transpolar Drift Stream moves in a more straight line across the North Pole. Positive winter AO favors less ice for the Arctic (Rigor et al., 2002).
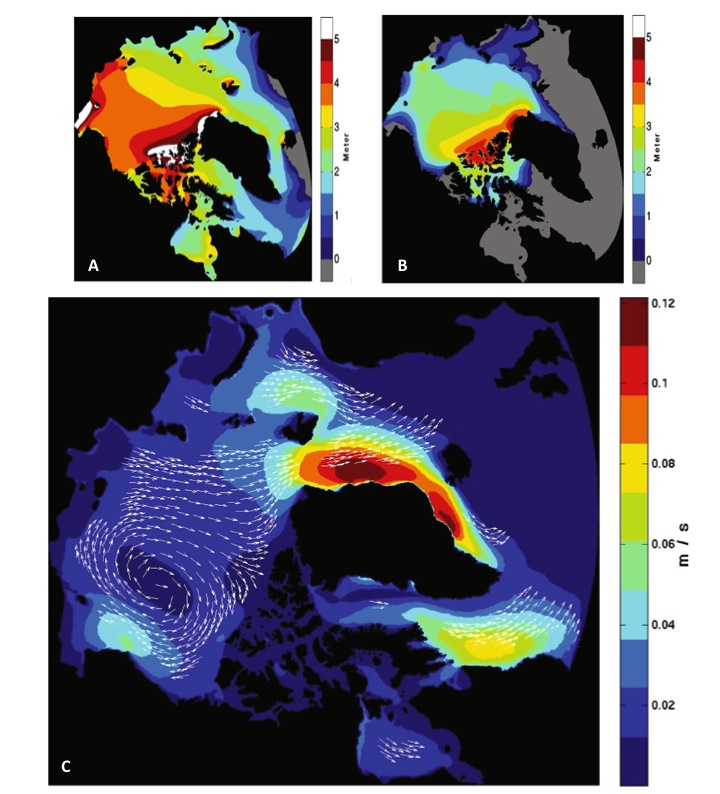
1979-2007 (B) Mean September sea ice thickness 1979-2007
(C) Mean modelled sea ice drift speed (m/s) and direction.
(Scheltinga, Myers, & Pietrzak, 2010)
Sea Ice Thickness and Motion Correlation
Terwisscha van Scheltinga, Meyers and Pietrzak recently modeled the complex inlets of the Canadian Arctic Archipelago to improve resolution, interpretation and variability of sea ice motion. Utilizing a coupled Sea-Ice Ocean model, mean sea ice thickness and associated drift were established (Figure 2). The model integrates the Beaufort Gyre, Transpolar Drift, and outlets (Fram Strait and Baffin Bay) to estimate the average sea ice drift in the Arctic Ocean to be approximately 2cm/second. The ice concentration is inversely proportional to the ice drift. As seen in Figure 2C, magnitude of drift is most rapid along the Fram Strait and Labrador Ocean which correlates to the areas of minimal mean ice concentration in Figure 2A and 2B. Moreover, the greatest ice thickness correlates with the slowest motion in Beaufort Gyre and the Canadian Arctic Archipelago. This circumstance coupled with the complex series of Canadian Arctic islands provides an obstruction, prohibiting extensive sea ice drift through to Baffin Bay (Scheltinga, Myers, & Pietrzak, 2010).
Sea Ice Motion Animations
The animations below use data from the Advanced Microwave Scanning Radiometer (AMSR-E) satellite from the US National Snow and Ice Data Center (NSIDC). By operating in the microwave region of the electro-magnetic spectrum (instead of visible light), the satellite sensor is able to view the sea ice surface without solar illumination and through most clouds and precipitation. Only in the presence of very thick cloud or heavy precipitation is the sea ice surface not visible. As summer approaches, these conditions occur more frequently until the sea ice surface is almost completely not visible to the satellite in July and August. The images in the video are in the standard sea ice polar stereographic 6.25 km grid and are colorized using both Horizontal and Vertical polarization 89 Ghz channels. Each image is a snapshot of sea ice cover each day with the date shown in the lower part of each image. When these images are animated, the faster cloud motions can be ignored. Sea ice shows up as various shades of grey and open ocean as blue. In general, lighter shades of grey are newly-formed, thin first year ice, and the dark grey is older, thick multi-year ice. The motion of large ice floes and the formation of cracks in the ice (leads) can be seen quite well during the winter months.
This video shows daily sea ice motion from 28 September 2003 to 10 May 2004. It covers the winter months when the sea ice concentration in the Arctic is growing from the minimum extent in September to the maximum extent in March. The video shows that sea ice is under constant motion. Large volumes of sea ice are flushed out of the Arctic Ocean through Fram Strait to the Greenland Sea. Ice is also flushed from the Arctic Ocean to Baffin Bay through Nares Strait (west of Greenland). Another important feature is the clockwise motion of the sea ice in the Beaufort Sea region. High Sea Ice Concentration Video (2003-2004)
This video shows daily sea ice motion from 1 October 2007 to 7 January 2008. The Arctic sea ice extent dropped to a historic minimum in September 2007. Compared to the sea ice cover of winter 2003-2004, the sea ice extent in winter 2007-2008 is much smaller. Large areas in the Siberian half of the Arctic Ocean are ice free even as late as December 2007.Low Sea Ice Concentration Video (2007-2008)
From Polar Data Catalogue on YouTube.
Sea Ice Motion Summer 2004 (April 1st to September 30th):
During the summer months, sea ice coverage in the Arctic decreases. The sea ice motion is not as strong as in winter.
Sea Ice Motion Video (Summer 2004) from Polar Data Catalogue on YouTube.
The archive version of the animations can be downloaded from the following links:
This page was edited and updated by Wenxia Tan in November 2011 and Maren Pauly in June 2013 (both Department of Geography, University of Waterloo). The animations shown on this page are provided by Mr. Tom Agnew, who is a Research Meteorologist retired from the Climate Research Branch, Meteorological Service of Canada.