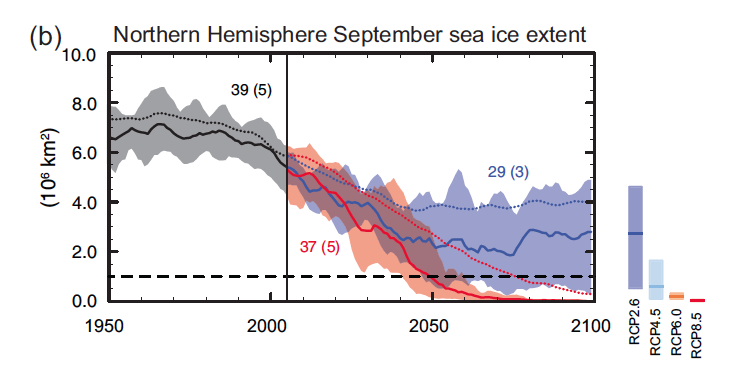
sea ice extent using CMIP5 coupled ocean-atmosphere
climate model. Emission scenarios (RCPs) indicated in
colour, observations in black, and shaded areas indicate
uncertainty (IPCC, 2013)
Although climate models almost universally agree on the sign of climate change (positive change, i.e. warming), there is still uncertainty in the projections from different models (Figure 1). The true warming is very likely to lie somewhere within the spread, but we do not yet know exactly where. A warming of 3°C will likely mean we are in a very different world compared to a warming of 8°C; therefore, it is important that we narrow the spread in the model projections. Climate models include feedback processes such as SAF, but the strength of the feedbacks is different from model to model. This is one process that contributes to the uncertainty (Qu and Hall, 2007). Climate scientists are currently trying to improve the realism of their models (Lawrence et al., 2012), and at the same time improve our understanding of the natural processes that contribute to climate feedbacks, such as SAF (e.g. Fletcher et al., 2012). This will help us to narrow the spread, and thus reduce the uncertainty, in projections of future warming.
Figure 2 depicts the annual mean precipitation between 1980 to 1990 that was (a) observed and (b) predicted. This shows the potential temporal and spatial accuracy models may possess. Although these two scenarios are close to identical, these models are based upon known climatic processes and feedbacks. In the face of climate change, when the Earth is unbalanced from anthropogenic influences, these known processes and feedbacks are expected to alter. For this reason, climate model predictions of the future maintain some uncertainty. These predicted changes are expected to vary spatially (Figure 3) with more intense changes occurring in polar regions (IPCC, 2007).
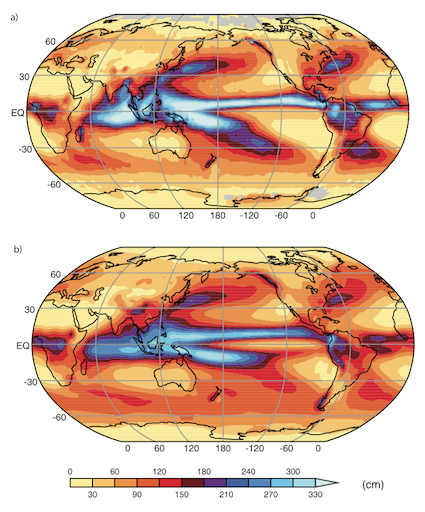
(a) Observed and (b) predicted annual mean precipitation 1980-1990 (IPCC, 2007).
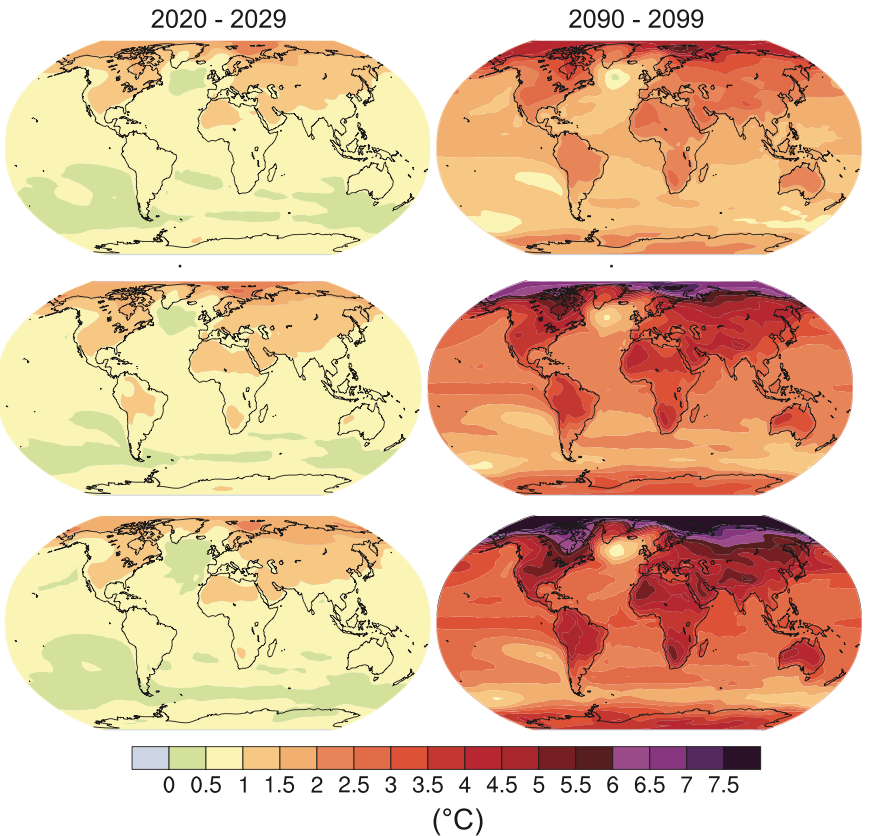
Predicted surface air temperatures for three scenarios B1, A1B and A2 descending in order for the time periods (a) 2020-2029 and (b) 2090-2099 (IPCC, 2007)
Overall, recent modelling output and in-situ observations have concluded the following:
- The atmospheric carbon dioxide levels have surpassed 400ppm, the highest in the past 3 million years
- This anthropogenic increase in greenhouse gases has increased global temperatures by 0.74°C in the past century with temperatures expected to increase by 1.8-4.0°C by the end of the current century
- With increased temperature and melting of land ice, sea level is predicted to increase by 0.18-0.59 meters by the end of the century (IPCC, 2013; National Geographic, 2013)
A number of climate model outputs are available for viewing on the web. Three such sites are listed below. The following sites contain Canadian climate model data that can be accessed and/or downloaded:
- Canadian Centre for Climate Modelling and Analysis
- Ontario Climate Change Data Portal
- Pacific Climate Impacts Consortium Data Portal
References
Climate Modelling Links
Material for this page was provided by Professor Christopher Fletcher, Assistant Professor, Core Member of IC3, Maren Pauly, and Tristan Mills, all Department of Geography and Environmental Management, University of Waterloo.