From 1951-2000, trends toward earlier water-clear-of-ice dates have been observed for many lakes during the latter part of the 20th century in Canada, but complete freeze over dates have shown few statistically significant trends over the same period (Duguay et al., 2006; Latifovic and Pouliot, 2007). Figures 1 and 2 show examples of the identified trends across Canada from 66-1995. Trends in freeze-up that were statistically significant tended to be located in regions where the autumn 0°C isotherm reflected a similar trend, and the trends towards later freeze-up corresponded with areas of increasing fall snow cover. Trends in break-up (Figure 2) became increasingly earlier for most of the country, with strong relationships to other lakes in close proximity and a strong relation to the 0°C isotherm dates. Western Canada showed the strongest trends towards earlier break-up, consistent with changes in the spring snow cover duration.
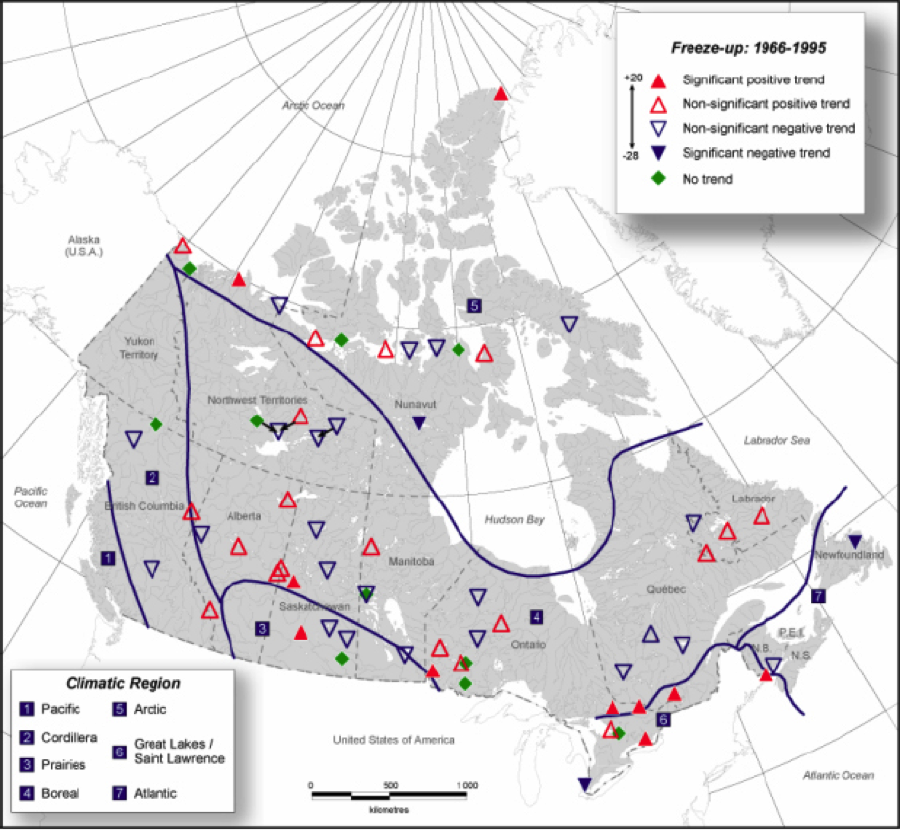
Figure 1:Trends in freeze-up dates observed at lakes in Canada between 1965 and 1995. Downward pointing arrows indicate a trend towards earlier dates while upward pointing arrows indicate a trend towards later dates. Open symbols indicate that the trend is not significant while solid symbols indicate that the trend is significant at the 90% confidence level (modified from Duguay et al., 2006).
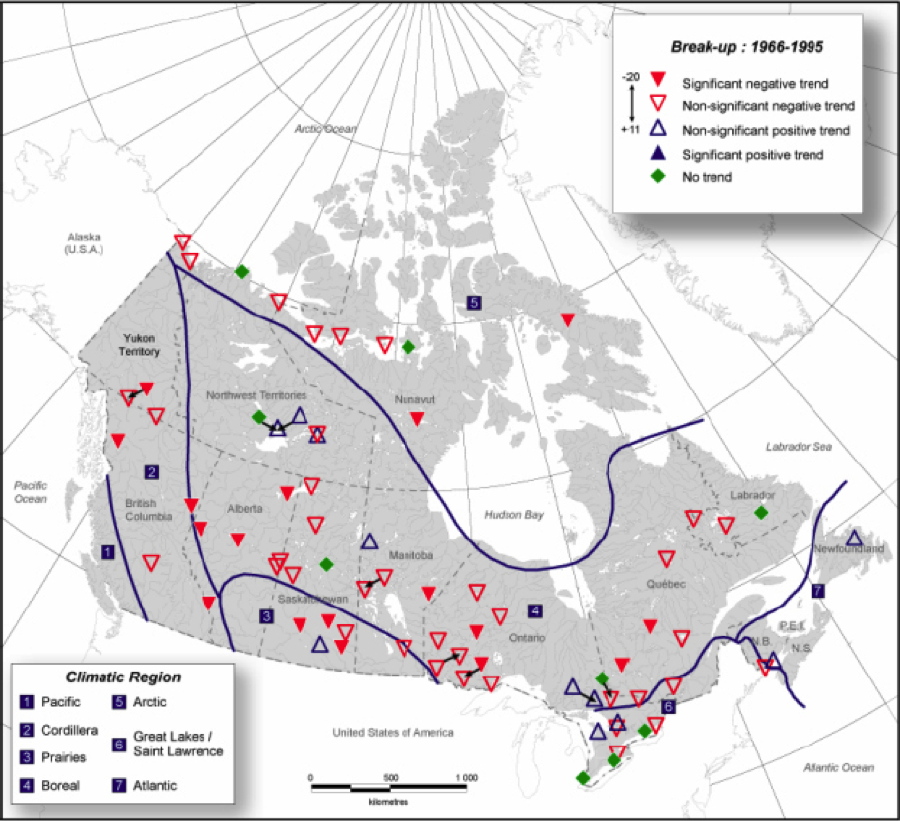
Figure 2:Trends in break-up dates observed at lakes in Canada between 1965 and 1995. Downward pointing arrows indicate a trend towards earlier dates while upward pointing arrows indicate a trend towards later dates. Open symbols indicate that the trend is not significant while solid symbols indicate that the trend is significant at the 90% confidence level (modified from Duguay et al., 2006).
Statistically significant long-term trends have been shown in south-central Ontario, using ice records dating back to 1853 (collected largely by volunteer monitoring efforts) (Futter, 2003; Fu, Yao, 2015). The long term trend of earlier ice break-up, from 1853-1995, found by Futter (2003) can be attributed to the end of the Little Ice Age, while an alternating trend of warming and cooling periods was shown depending on the blocks of years analyzed. Lake Simcoe, Ontario, for example, showed a warming trend from 1853 to 2001; however, only 1853-1899 was statistically significant, while 1900-1949 actually showed a cooling trend, and 1950-1995 showed a slight warming trend. Alternating trends have been also been noted in long term phenology records by Magnuson et al. (2001) when data is split into blocks of years from 20 to 50 years, clearly outlining the importance of the length of the time series used when interpreting trend analyses (see Brown and Duguay, 2010, for more details on trend studies).
The observed changes in Canada's lake ice cover have also been influenced by large-scale atmospheric forcing indices such as El-Nino-Southern Oscillation (ENSO), the Pacific Decadal Oscillation (PDO), the Pacific-North American Pattern (PNA), the North Pacific oscillation (NP), the North Atlantic Oscillation (NAO) and the Arctic Oscillation (AO) (e.g. Bonsal et al., 2006; Wang et al., 2012). Ice cover changes on lakes have been shown to be more responsive to the extreme phases of the teleconnections, as well as combinations of multiple teleconnections. Generally, the Pacific indices have the strongest effects on ice cover in most of Canada - with the exception of the extreme eastern areas which are more affected by the North Atlantic Oscillation and the Laurentian Great Lakes region which is influenced both by the Pacific and Atlantic oscillations.
This page was edited and updated by Laura Brown, Maren Pauly, and Tristan Mills, all Department of Geography, University of Waterloo.