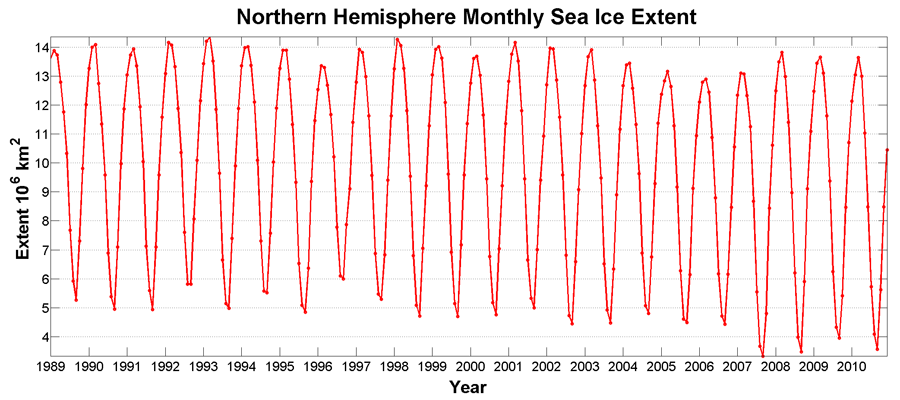
The annual Arctic sea ice cycle varies from a maximum of approximately 14 million square kilometres of ice cover in March of each year to a minimum of approximately 5 million square kilometres in September. Superimposed on this are changes from year to year. The average Arctic sea ice extent at the end of the summer since the 1970's has an obvious downward trend (Serreze, 2011). The lowest, second lowest, and third lowest minimum summer Arctic sea ice extents occurred in 2007, 2008 and 2009, respectively (Figure 1). Both the later start of freeze-up in the fall and the earlier start of melting in the spring lead to longer melt period throughout the year and contribute to the severe sea ice loss (Markus et al., 2009).
Figure 1: Monthly variability of sea ice extent over the Northern Hemisphere 1989-2010. Daily sea ice concentration data (Cavalieri, 1996, updated annually) are derived from Special Sensor Microwave/Imager (SSM/I) brightness temperature data. The original data are from Defense Meteorological Satellite Program (DMSP) and DMSP. Daily sea ice extent is the sum of grid cells in the satellite image that have an ice concentration larger than 15%. Monthly mean sea ice extent is calculated by averaging all the daily data for that month.
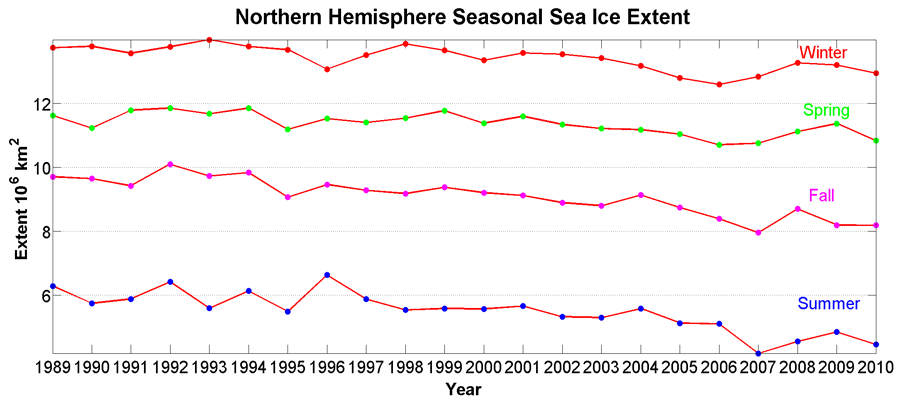
Figure 2: Monthly change in sea ice extent from 1989-2010 as compared to normal for the same period. Date sources are in Figure 1. Monthly anomaly is calculated by subtracting the climatology monthly mean of the 22-year period (1989-2010) from the observed ice extent for that month. The seasonal mean is the mean of each season, January to March (Winter), April to June (Spring), July to September (Summer), and October to December (Fall).
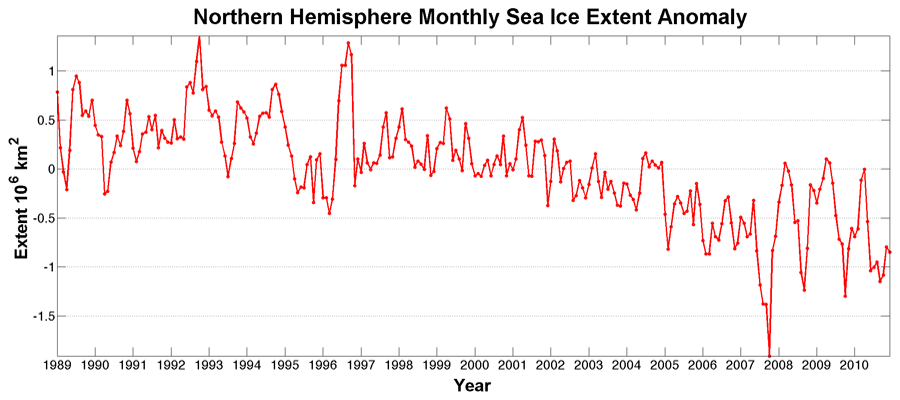
Figure 3 shows the monthly sea ice extent anomaly by month. In the last ten years, the monthly sea ice anomalies are almost all below zero, which is a sign of sea ice extent decrease, especially for the summer months. The lowest point is September 2007, which is the minimum sea ice extent for the satellite era (since 1979). The cause of this extreme low is still under debate.
References
Sea Ice Links
Material for this section was provided and edited by Wenxia Tan, November 2011, and edited by Tristan Mills, both Department of Geography, University of Waterloo.